Re-🧢
Hello brave adventurers, and welcome back! This is a continuation of What is System Calls. But before we begin, let’s do a quick recap.
Recall
Windows has two modes: User mode and Kernel mode.
These modes help protect the operating system from breaking. The transition between them happens via syscall instructions.
Examine the Bytes
Based on our previous discussion 🤣, we already know how the application’s flow works and which corresponding APIs are involved. So, let’s examine it ourselves by writing a simple piece of code like the one below:
#include <windows.h>#include <iostream>
int main() { HANDLE hOThread = OpenThread( THREAD_QUERY_INFORMATION, FALSE, GetCurrentThreadId() );
std::cout << "Thread Handle: 0x" << hOThread << std::endl; CloseHandle(hOThread);
return 0;}Note to self: make sure you compile it for the correct architecture!!!
X64dbg
I’m assuming all of you adventurers are on a 64-bit operating system. Right?? YES! Nice 👍. Welp, we’re going to throw our program into X64dbg for some good ol’ debugging.
First, let’s search for OpenThread in the Symbols section. Make sure you’ve selected kernelbase.dll before searching.
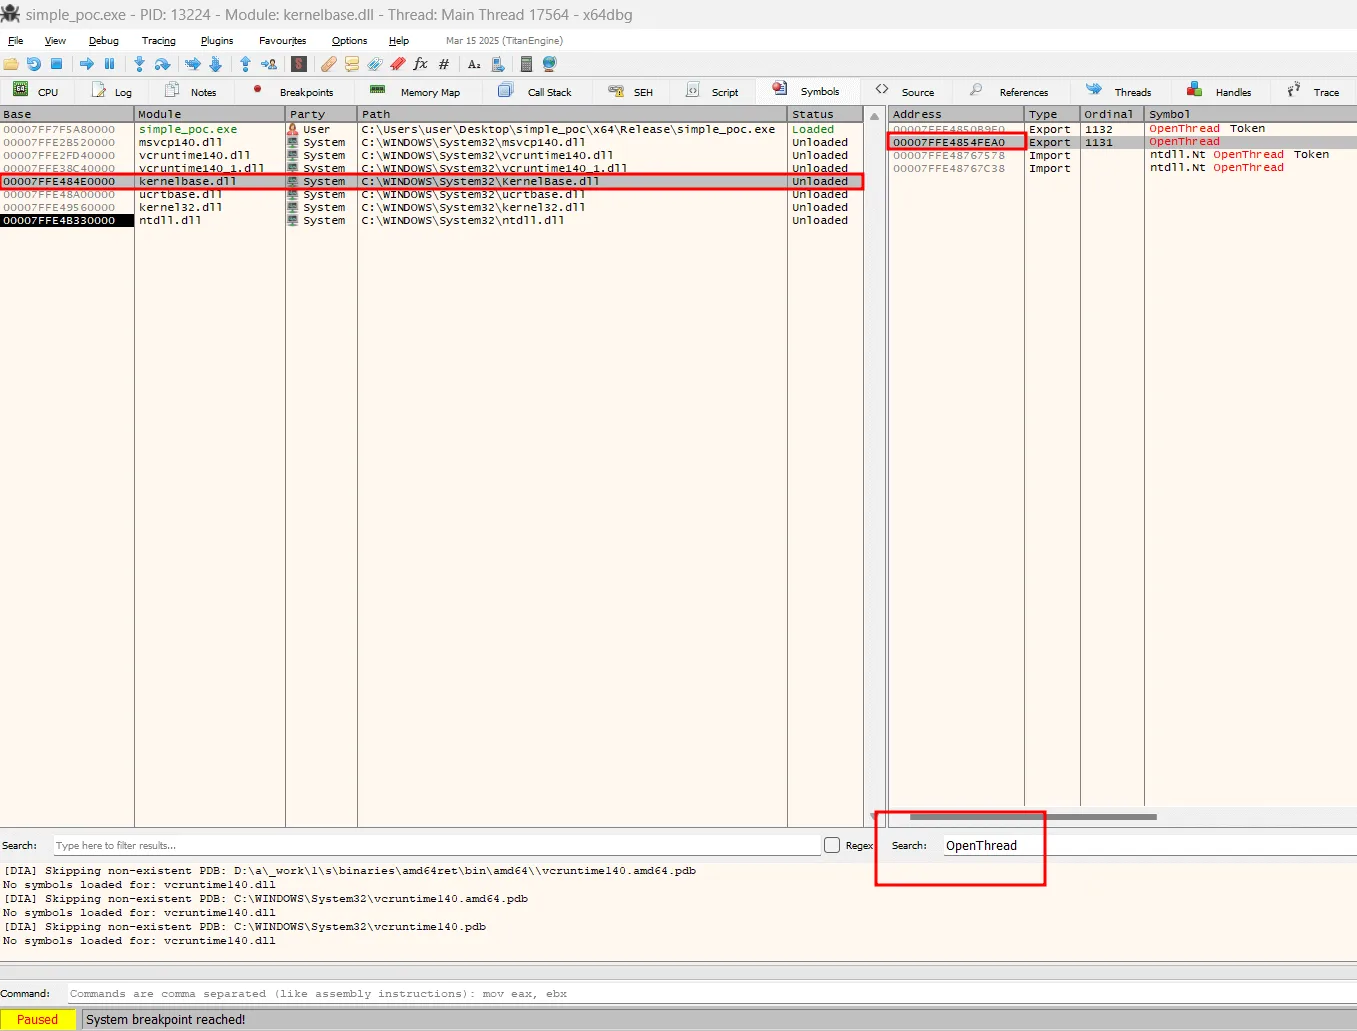
Search OpenThread
Double-clicking the address will take us to another section. If the view looks confusing (just like it did for me at first), no worries! Right-click anywhere and select Graph to activate the graph view.
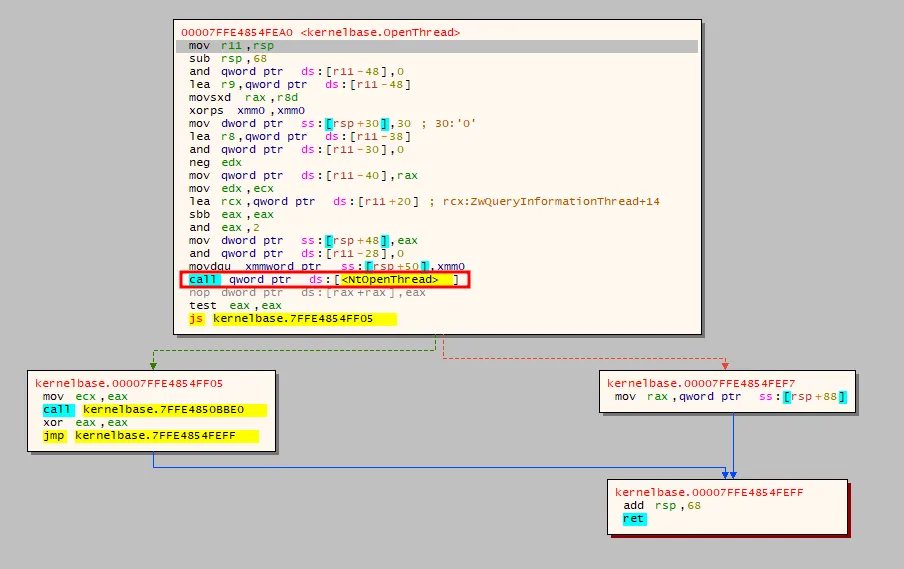
OpenThread in lovely Graph view
Notice this line: call qword ptr ds:[<NtOpenThread>]?
This is just a small placeholder, called a stub, that tells the program to jump to the real NtOpenThread function inside ntdll.dll.
Double-clicking the function name will take you to where the real code lives-in a new graph view.
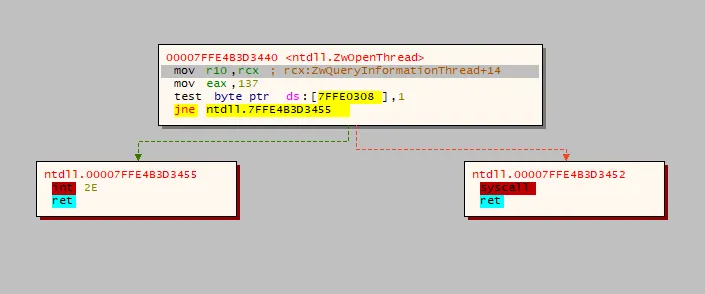
Flows of syscall
This chunk of the block shows how the function sets up its arguments. Once that’s done, it moves to the relevant syscall number, 137 in my case (see line 3).
Summary
Based on this, we can clearly see how the flow works.. right??
It goes something like this:
OpenThread → NtOpenThread/ZwOpenThread → syscall (with arguments set up by ntdll.dll, as we discussed earlier).
-
Note:
kernelbase.dllis not the Win32 API itself but a DLL that implements a large portion of it. -
Note:
NtOpenThreadandZwOpenThreadtypically point to the same function address inntdll.dll. On modern Windows systems,Nt*andZw*functions are usually just aliases for the same syscall stubs.
WinDbg
Plot twist! HIHIHIHI (idk why, but it sounds cool tho).
Anyway, we can also examine syscall arguments using WinDbg. We’ll use the same program we created earlier for debugging.
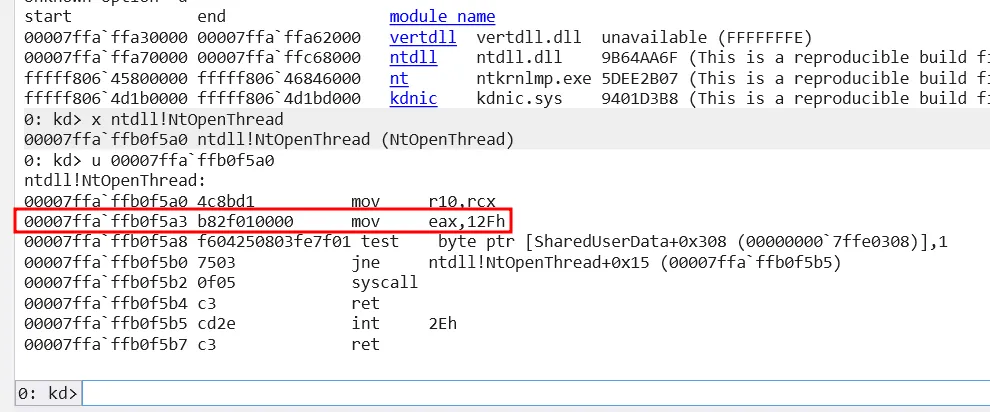
Let’s start by examining (x) the NtOpenThread symbol from ntdll.dll:
x ntdll!NtOpenThreadYou should see a result that looks something like this:
00007ffe`4b3d3440 ntdll!NtOpenThread (NtOpenThread)Next, let’s tell WinDbg to disassemble (u) this memory address:
u 00007ffe`4b3d3440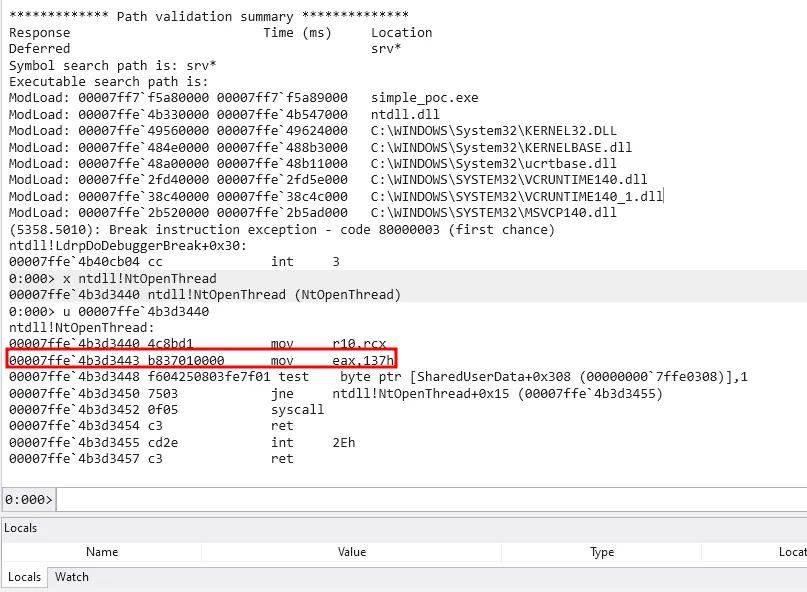
Syscall instructions
As you can see, the result looks identical to what we saw in X64dbg. Notice that number again? What the fish is that? 🧐
System Service Number (SSN)
That number 137, or 137h, or in hex 0x0137, is called the System Service Number (SSN). It identifies which system call is being made, and it tends to change with every Windows update.
Big shoutout to Mateusz “j00ru” Jurczyk for maintaining the Windows x86-64 System Call Table, which tracks all these changes!
Ok… so what? 🤷System Service Dispatch Table (SSDT)
Well, the kernel uses this number (the SSN) to figure out which internal kernel function to call. It does this by looking it up in the System Service Dispatch Table (SSDT), also known as KiServiceTable.
To simplify things for my monkey brain 🍌 LOL:
Example
Imagine the SSDT as a row of mailboxes, and each one contains a slip of paper with an address written on it (not the actual message).
The SSN is the number of the mailbox itself—like mailbox #1, mailbox #2, etc.
Here’s the equation the kernel uses:
RoutineAbsoluteAddress = KiServiceTableAddress + (routineOffset >>> 4)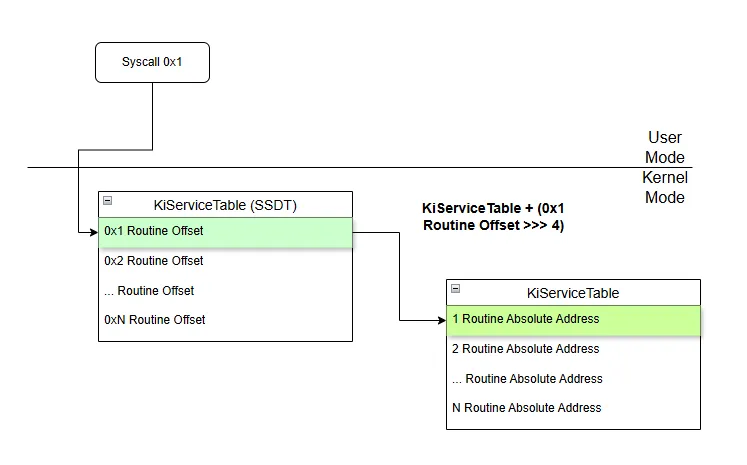
SSDT Flows
Let’s see this in action, shall we?
But first.. we need to set up a controlled environment because we’ll be debugging the kernel itself.
Or… feel free to skip it if you want. You do you, baby! 😎
For this demonstration, I’ll be using a Windows 10 VM.
Make sure the network is set to NAT, and that both the Guest and Host can reach each other.
Next, we need to install Debugging Tools for Windows via the Windows SDK installer inside the VM.
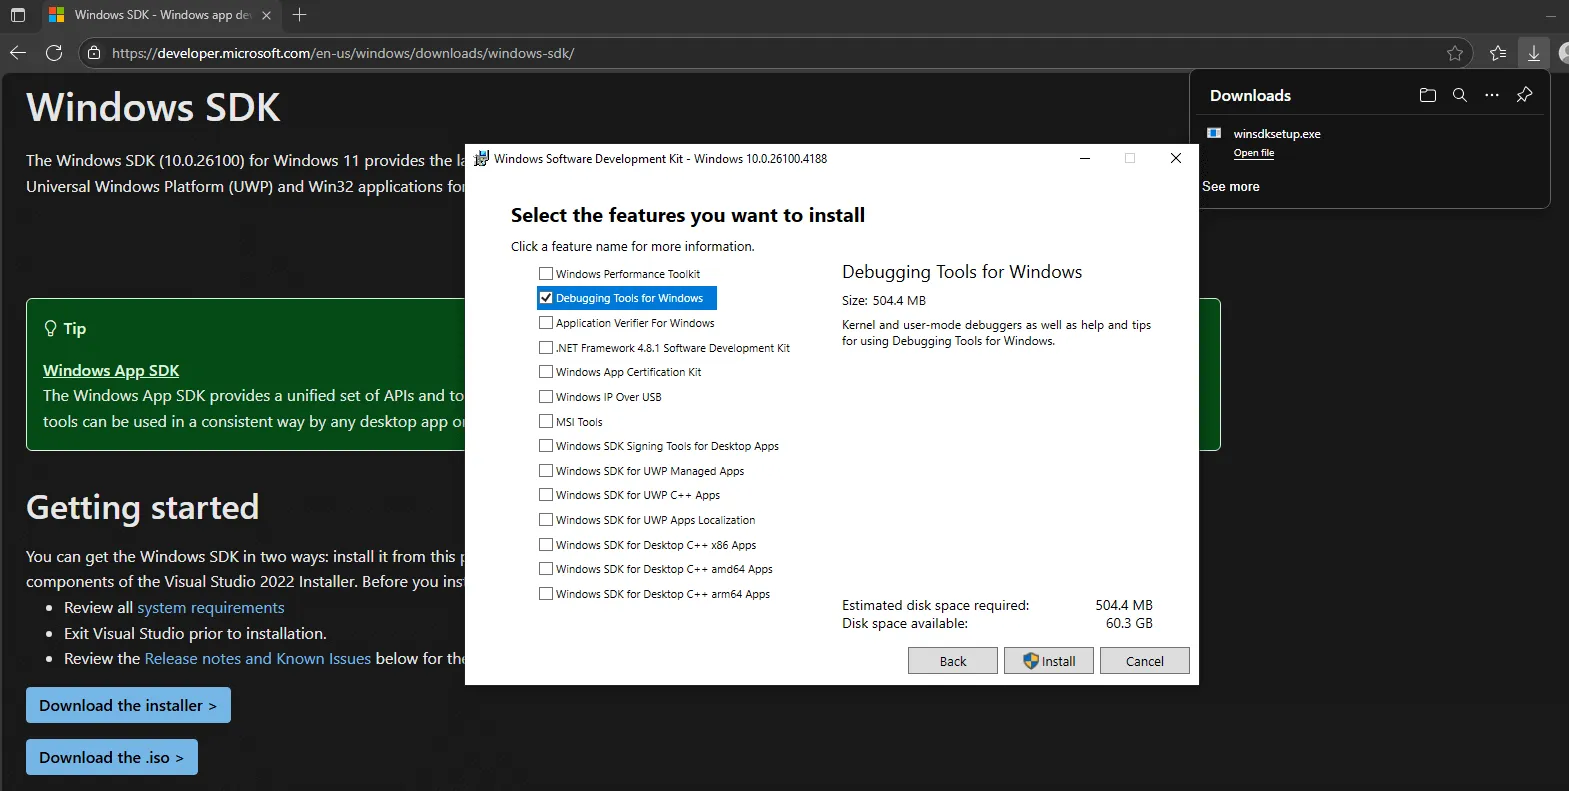
Install Debugging Tools for Windows
Once the installation is complete, navigate to:
C:\Program Files (x86)\Windows Kits\10\Debuggers\x64\Assuming you’re on a 64-bit VM 🤗 — if not, check the x86 folder instead.
Now, run kdnet.exe as Administrator. It will list supported NICs.
If nothing shows up, try rebooting the VM.
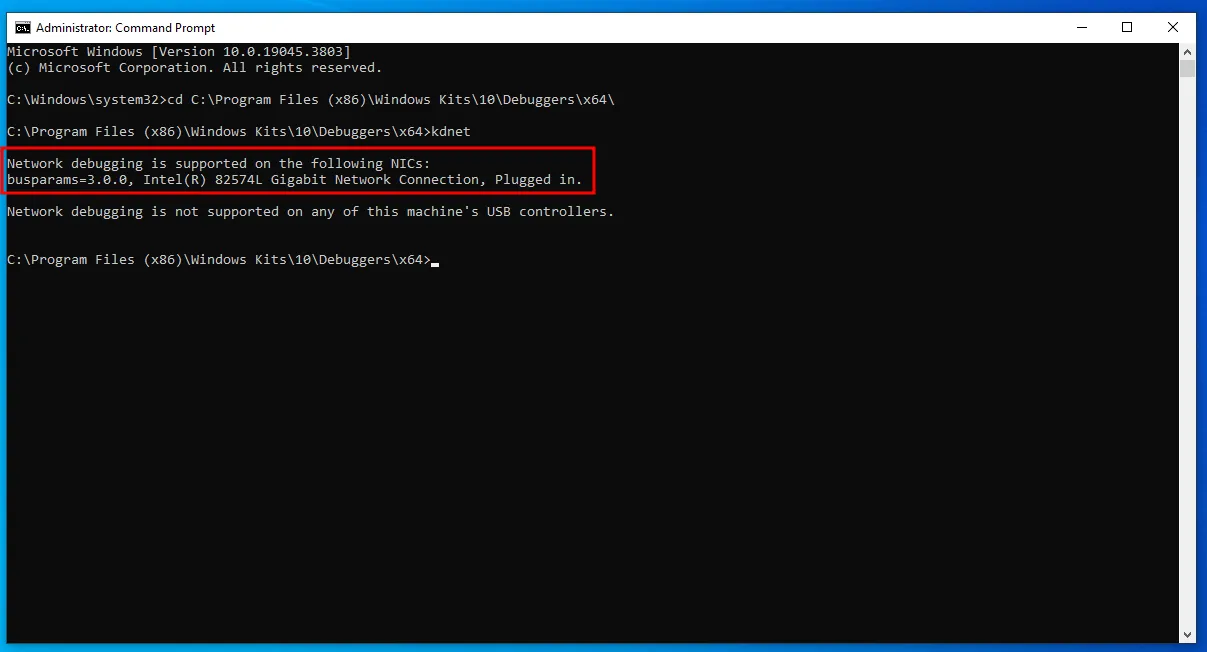
Execute kdnet.exe
Let’s generate a debugger key by running the command:
kdnet <YOUR_HOST_MACHINE_HOSTNAME> 50030The port can be anything between 50000 and 50039.
It will output a randomly generated key string and mine was:
12ilzmohc9flq.2jywbt3jbfit7.2pylc5m0edeak.1az7030yfsahoCopy that key, we’ll need it in the next step.
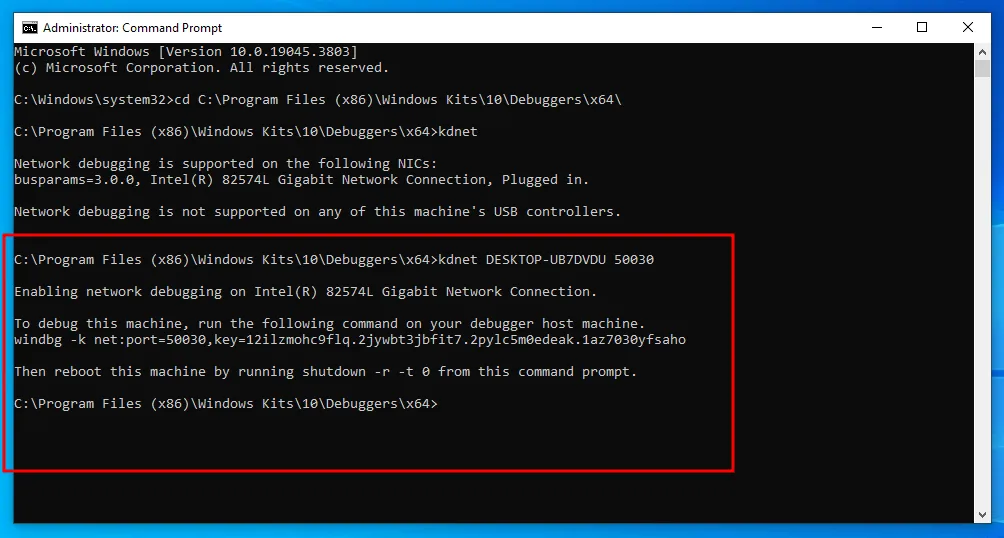
Generate random key
Now switch over to your host machine, launch WinDbg, and configure it to connect to the VM: File -> Start debugging -> Attach to Kernel -> Net.
Fill in the port number and key (the randomly generated key from earlier). Also, uncheck the Break on connection option, then click OK.
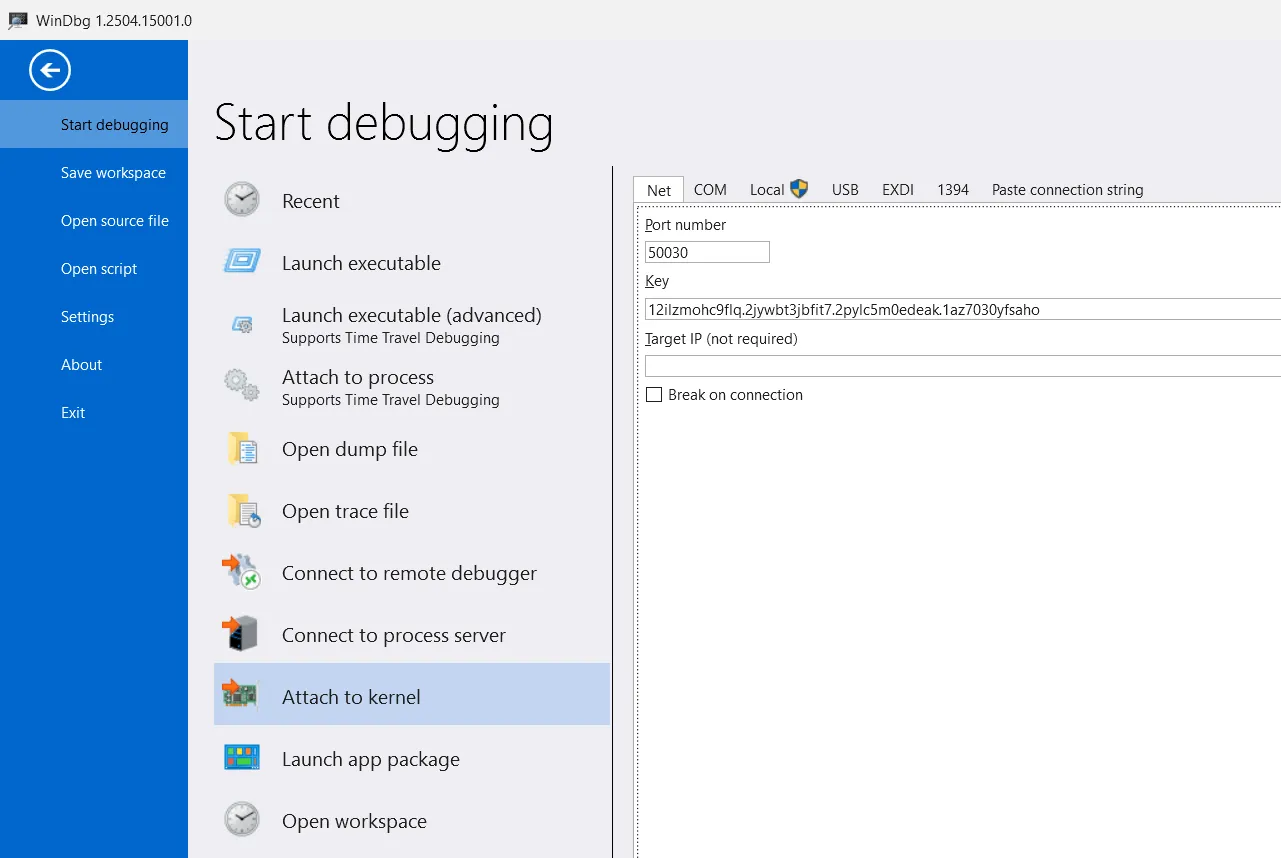
Configure WinDbg
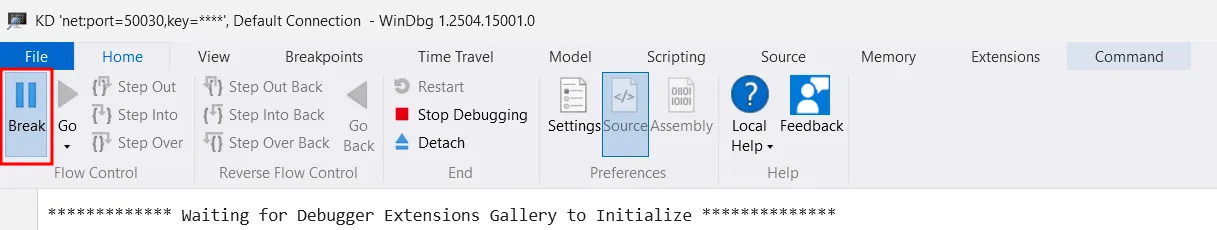
You’ll see a message that says: Waiting to reconnect...
Now, restart your VM. After rebooting, open a simple app like Notepad.
To start debugging, hit the Break button in WinDbg.
Time to Debug Baby!

STD SSDT in Action
Let’s force load/reload the ntdll symbols in the debugger:
.reload /f ntdll.dllThen, list the modules to ensure it’s loaded properly:
lm ntdll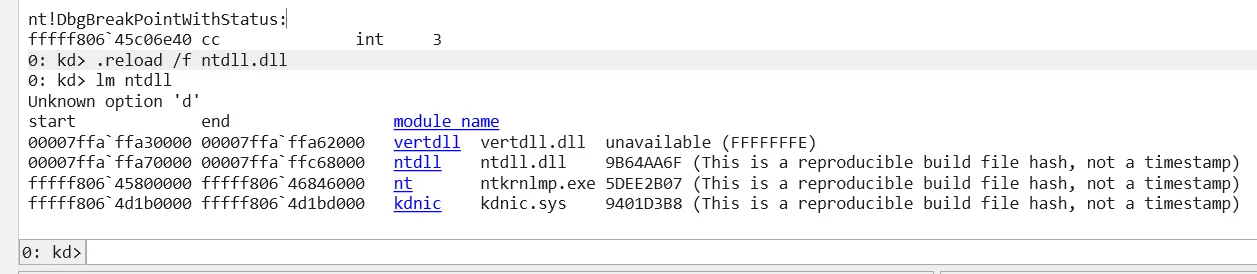
Load ntdll
Now, let’s find the System Service Number (SSN) for NtOpenThread, just like we did earlier. Notice something? The number has changed again! Since we’re on Windows 10, it’s now 0x012F (in hex).
NtOpenThread SSN
We need to find the routine’s absolute address using the 0x012F offset.
First, we look up the “mailbox” (our analogy for SSDT) entry that holds the “paper slip” (the offset) for NtOpenThread.
Confused? Yeah, same. But stick with me here 😅.
Dump the memory with the equation:
dd /c1 kiservicetable+4*0x012F L1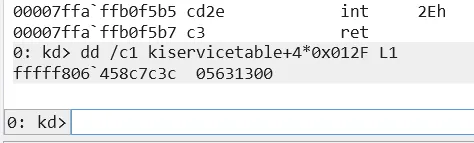
NtOpenThread = 05631300
The output tells us that the offset for NtOpenThread is 05631300.
Now let’s calculate the actual kernel routine address and disassemble it:
u kiservicetable+(05631300>>>4) L1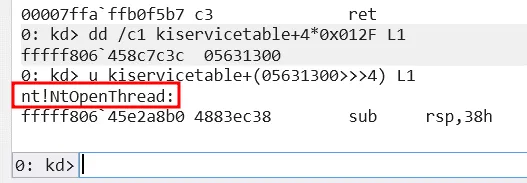
Kernel routine absolute address
Boom! 🎯
You’ll see the result is nt!NtOpenThread, which means:
When ntdll!NtOpenThread issues a syscall with ID 0x012F, the kernel will call nt!NtOpenThread.
I think that’s it for now… until next time! 👋
Stay curious, adventurers.
As always, your loot awaits, brave adventurers:
- Jack Halon - Red Team Tactics: Utilizing Syscalls in C# - Prerequisite Knowledge
- Amit Moshel - Intro to Syscalls & Windows internals for malware development Pt.1
- Crow - NTAPI Injection
- spotheplanet - System Service Descriptor Table - SSDT
- j00ru - Windows x86-64 System Call Table
- Dennis A. Babkin - Setting up WinDbg Next for kernel debugging via fast network connection in VMware VM.